Admin dashboard: business intelligence at a glance
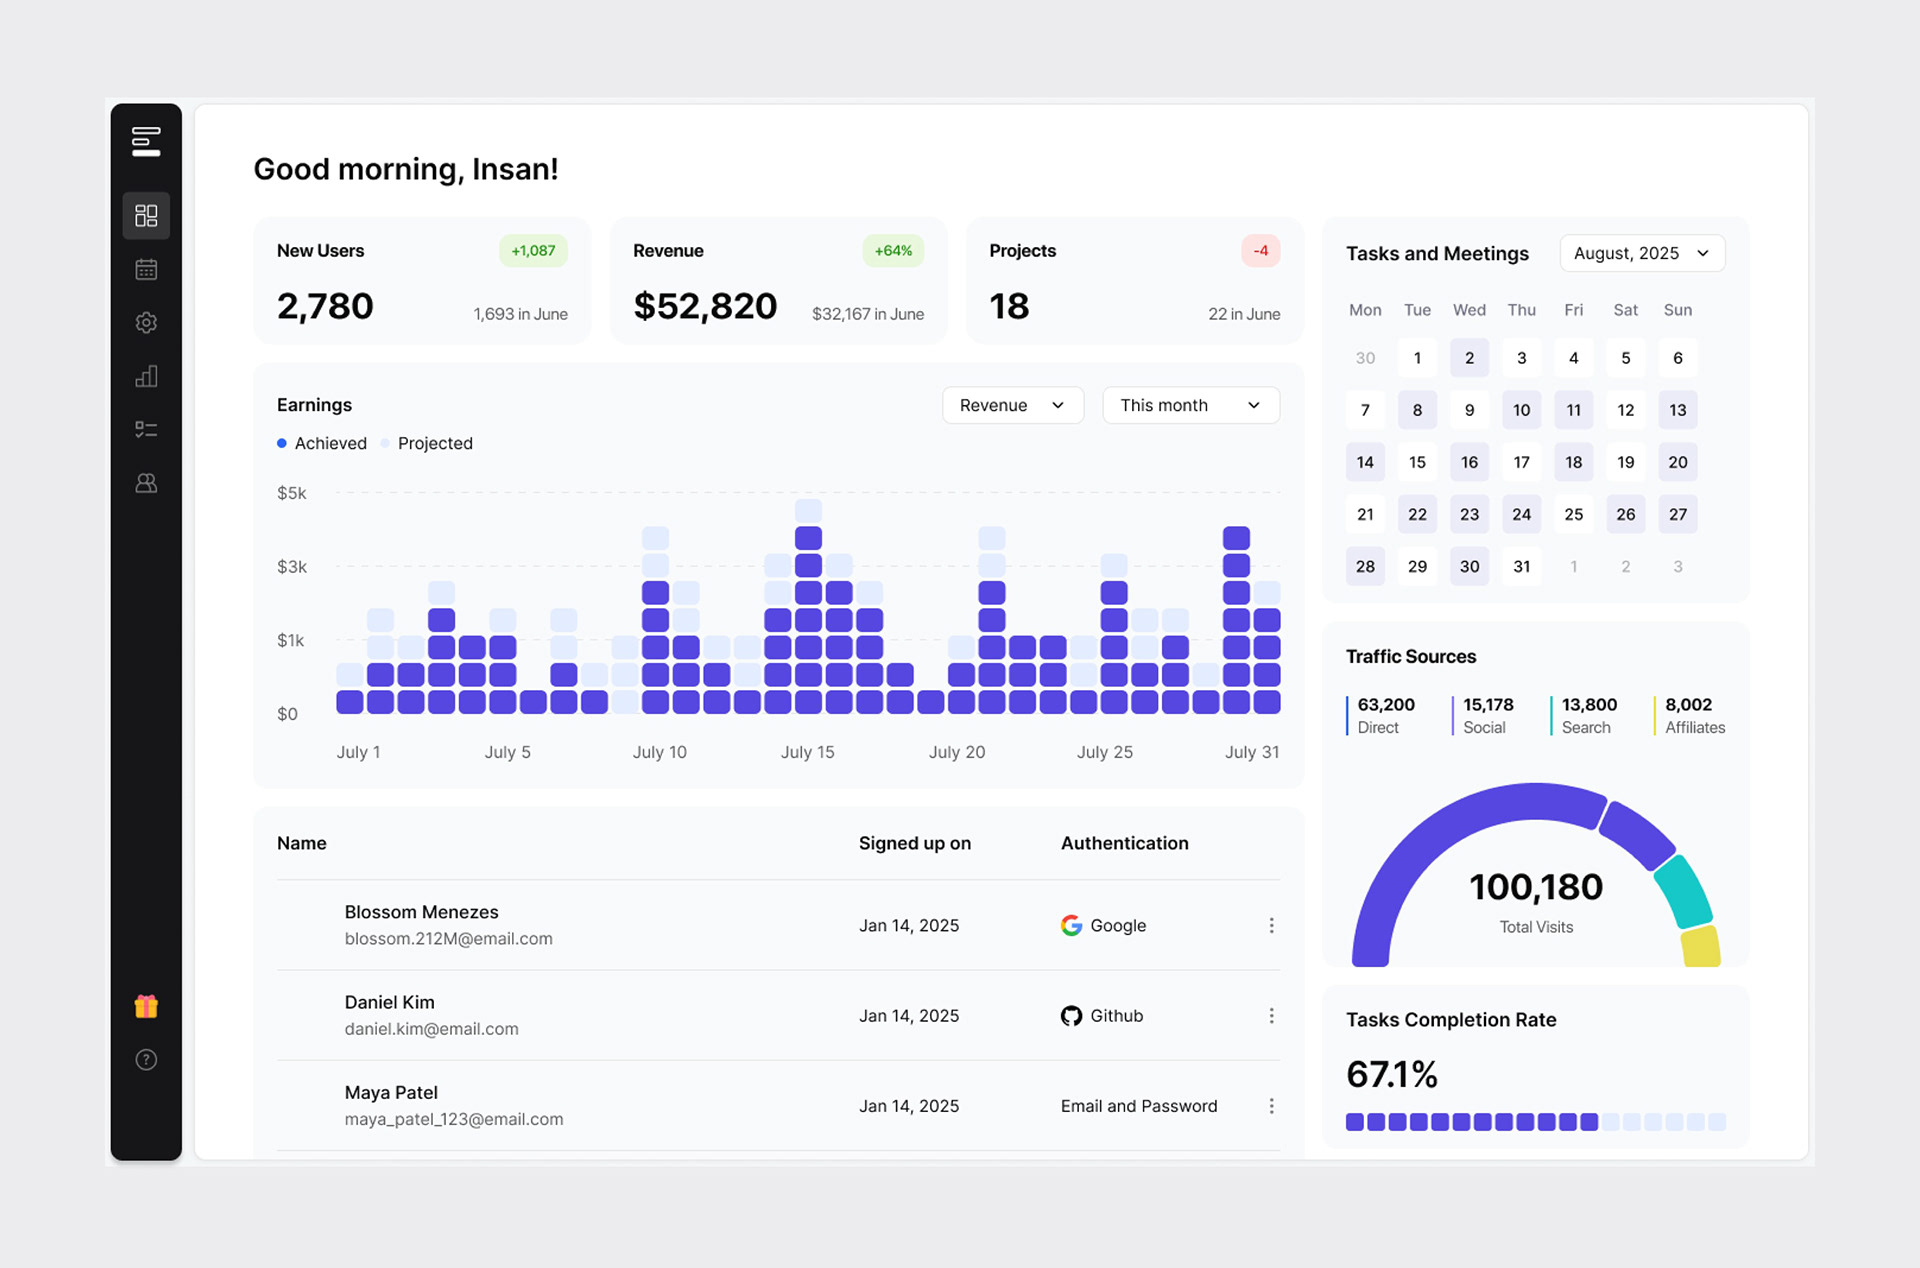
A comprehensive admin dashboard for tracking users, revenue, projects, and team performance. Built for SaaS founders and operations leads who need real-time visibility.
Five tools, 45 minutes, no single view
SaaS founders, operations managers, and growth leads checking metrics daily
A unified dashboard combining user metrics, revenue, projects, and traffic data
Every morning (10-second check) and weekly (deep-dive analysis sessions)
Web application, desktop-first, used as the first tab opened each morning
Founders check 5+ tools daily. Average 45 minutes compiling a business snapshot. No unified view exists
KPI cards with trend indicators, time-series charts, calendar widget, traffic breakdown, and user management table
Who we are designing for
Insan, 32
"I check metrics first thing every morning. I need it fast."
- Goals
- Morning snapshot, trend alerts
- Frustrations
- Too many tools, slow loading
Maya, 28
"I manage team workload and need to know who is available."
- Goals
- Task completion, team capacity
- Frustrations
- Manual status updates
Daniel, 35
"I track acquisition channels. I need to know what works today."
- Goals
- Traffic sources, conversion funnel
- Frustrations
- Delayed data, manual exports
The solution, delivered
Research-driven decisions compound
Every design choice traced back to a user insight. This made stakeholder alignment straightforward and reduced revision cycles significantly.
Consistency accelerates delivery
Using a shared design system across projects meant new screens could be assembled from existing components, cutting design time without sacrificing quality.